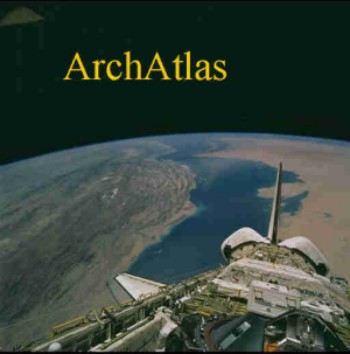
When astronauts first took photographs of Earth from space, it transformed traditional images of the planet. Here, for the first time, were photographs of the world as it actually is. Systematic use of this information was at first confined to military objectives, but nowadays these images are familiar, as the backdrop to news items and weather forecasts. Moreover, they are now available as continuous cover, and can themselves be used as maps. ArchAtlas began in Oxford in 2000, as a means of making available the kinds of images and interpretations which are more easily disseminated through a website than by conventional paper publication. In 2005, ArchAtlas was moved to Sheffield.
Why an electronic atlas of archaeology?
Maps make sense of history, and prehistory. Space and time are the dimensions within which things happen, and both must be considered together. (Whoever had the bright idea of separating history and geography into separate academic subjects?) Electronic publication allows a new flexibility, in making it possible to produce as many maps as are needed, for instance to resolve a long time-sequence into its individual phases, and even to animate patterns of development. Satellite imagery and elevation data have transformed the simple idea of a "map" from being a simplified diagram into what is effectively a photograph or a three-dimensional representation, conveying a much more effective sense of place. The two provide a powerful combination, especially when data and imagery are georeferenced (tied to a common global co-ordinate system) so that they can be combined at will using GIS.
This website explores some of the applications of these ideas and techniques. It is in a constant state of development, as new material becomes available, and we strive to keep up with it. Feedback is welcome, and accurate data on site-locations is especially desirable.
This exercise in presenting archaeological information in maps has underlined some basic deficiencies in current archaeological practice. Especially in critical regions such as the Mediterranean and the Near East, few sites have accurate, published co-ordinates, which allow them to be precisely located and reliably related to others. Site-reports typically show a contour-map of the tell, and then a national outline with a dot (which, at the scale of the map, would be bigger than New York!). Distribution-maps of sites are hard to compare, and it is not easy to fit the many excellent intensive survey projects into a wider framework.
GIS provides a way of integrating evidence at different scales of analysis, and zooming from one level of resolution to another. It allows a seamless exploration of the factors operating on different scales: site-specific, landscape, regional, continental, global. Sites can be analysed both in terms of their location on fertile soils, for instance, and their positions on regional and inter-regional trade-routes. A realistic explanation must encompass all of these levels. GIS is not just an advance in methodology, it is a tool in the construction of more sophisticated theory, and a way of telling history.
 Occasional Papers (2009-)
 Site Visualisations